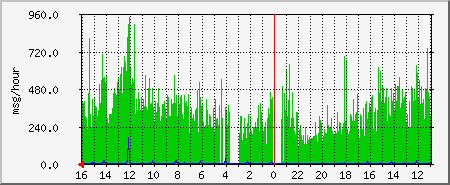
| Max total | 946.0 M/h (9.5%) | Average total | 360.0 M/h (3.6%) | Current total | 432.0 M/h (4.3%) | ||
| Max failures | 167.0 M/h (1.7%) | Average failures | 2.0 M/h (0.0%) | Current failures | 0.0 M/h (0.0%) |
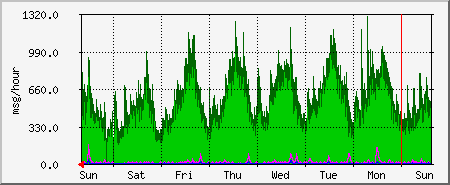
| Max total | 1308.0 M/h (13.1%) | Average total | 475.0 M/h (4.8%) | Current total | 341.0 M/h (3.4%) | ||
| Max failures | 168.0 M/h (1.7%) | Average failures | 2.0 M/h (0.0%) | Current failures | 0.0 M/h (0.0%) |
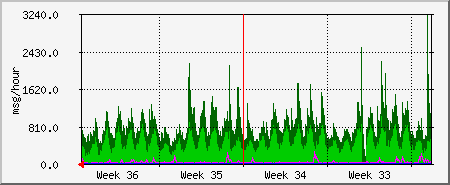
| Max total | 3240.0 M/h (32.4%) | Average total | 499.0 M/h (5.0%) | Current total | 575.0 M/h (5.8%) | ||
| Max failures | 264.0 M/h (2.6%) | Average failures | 2.0 M/h (0.0%) | Current failures | 9.0 M/h (0.1%) |
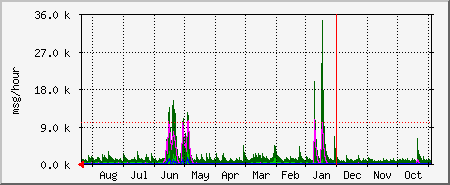
| Max total | 34.8 k M/h (347.6%) | Average total | 485.0 M/h (4.9%) | Current total | 488.0 M/h (4.9%) | ||
| Max failures | 10.8 k M/h (107.5%) | Average failures | 29.0 M/h (0.3%) | Current failures | 3.0 M/h (0.0%) |
| GREEN ### | Messages Per Hour |
| BLUE ### | Failures Per Hour |
| DARK GREEN### | Maximal Messages Per Hour |
| MAGENTA### | Maximal Failures Per Hour |
| 2.10.15 | Tobias Oetiker <oetiker@ee.ethz.ch> and Dave Rand <dlr@bungi.com> |